
 Log in
Reading the Rain: Six Seasons on Sulphur Mountain
Six completed rainfall seasons in Upper Ojai show how much can change between one harvest and the next. From approximately 6.5 inches in 2020–2021 to 53.35 inches in 2022–2023, the record reveals not only wet and dry years, but different rhythms within each winter. At Ojai Mountain, those patterns help guide vineyard care alongside soil conditions, vine development and strategic supplemental irrigation.

A vintage begins long before harvest. Winter rain changes the conditions the vines will meet in spring, and the timing can matter as much as the total.
At Ojai Mountain, the first vines were planted in 2018 and the first vintage followed in 2020. The six completed water years associated with our 2020–2025 harvests offer a useful record of the vineyard's early life: four below the local rainfall benchmark, two well above it, and very different patterns within each winter.
The numbers do not tell us exactly how a wine will taste. They help explain the conditions the farming team had to work with.
How to read the rainfall record
The figures come from Ventura County Watershed Protection District's
A
The station report uses an annual rainfall benchmark of
| Water year | Associated harvest year |
|---|---|
| 2019–2020 | 2020 |
| 2020–2021 | 2021 |
| 2021–2022 | 2022 |
| 2022–2023 | 2023 |
| 2023–2024 | 2024 |
| 2024–2025 | 2025 |
The 2020–2021 monthly record sums to 6.51 inches, which we round to approximately 6.5 inches.
Why the timing matters
A vine does not experience rain as an annual average. It encounters water at particular stages: dormancy, budbreak, flowering, berry development and ripening.
Winter rain can replenish soil moisture before active growth begins. How much remains available to the roots depends on more than the gauge total: storm intensity, runoff, drainage, soil depth, rooting and subsequent weather all matter.
Rain near flowering or harvest raises different questions from rain in December. Our guide to grapevine flowering and fruit set explores one of those important windows. But a monthly rainfall table cannot, by itself, establish whether flowering was disrupted, disease increased or berries became smaller. Those conclusions need vineyard observations and dates as well as weather records.
For the farming team, the useful questions are specific: how wet is this block, how are the shoots developing, what is the forecast, and does the vine need supplemental water? A seasonal total provides context. It does not answer those questions on its own.
Six seasons, six different patterns
2019–2020: rain on either side of a dry midwinter
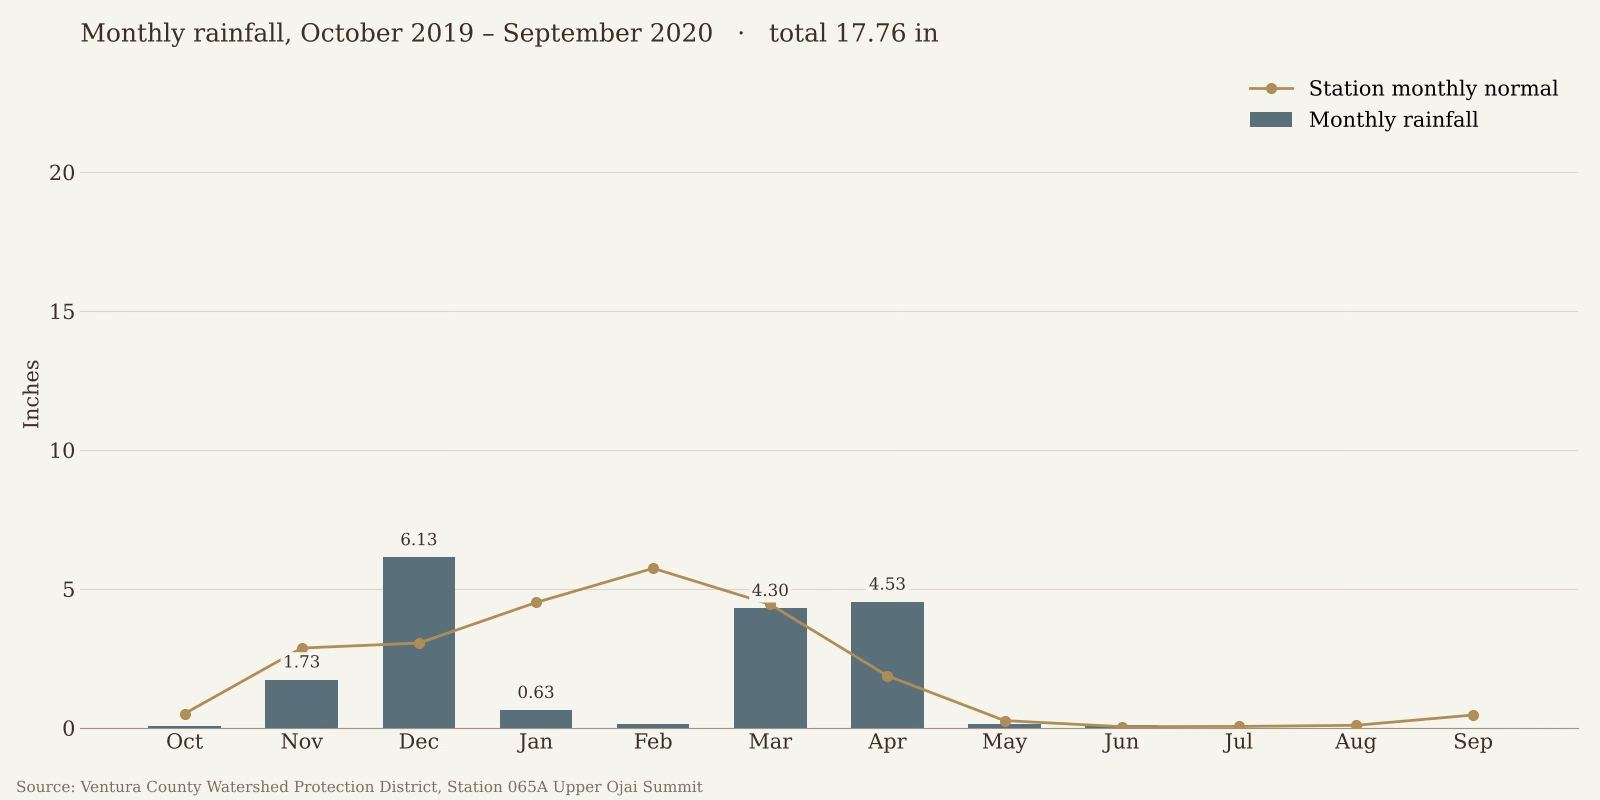
December brought 6.13 inches, followed by just 0.63 in January and 0.12 in February. March and April then added 4.30 and 4.53 inches respectively.
The season finished below the annual benchmark, but “dry year” alone misses its shape. Rain arrived in substantial installments before and after a notably dry stretch. For the vineyard's first harvest year, that sequence offers more context than the total by itself. The 2020 harvest notes follow the season through to our inaugural vintage.
2020–2021: the leanest of these six seasons
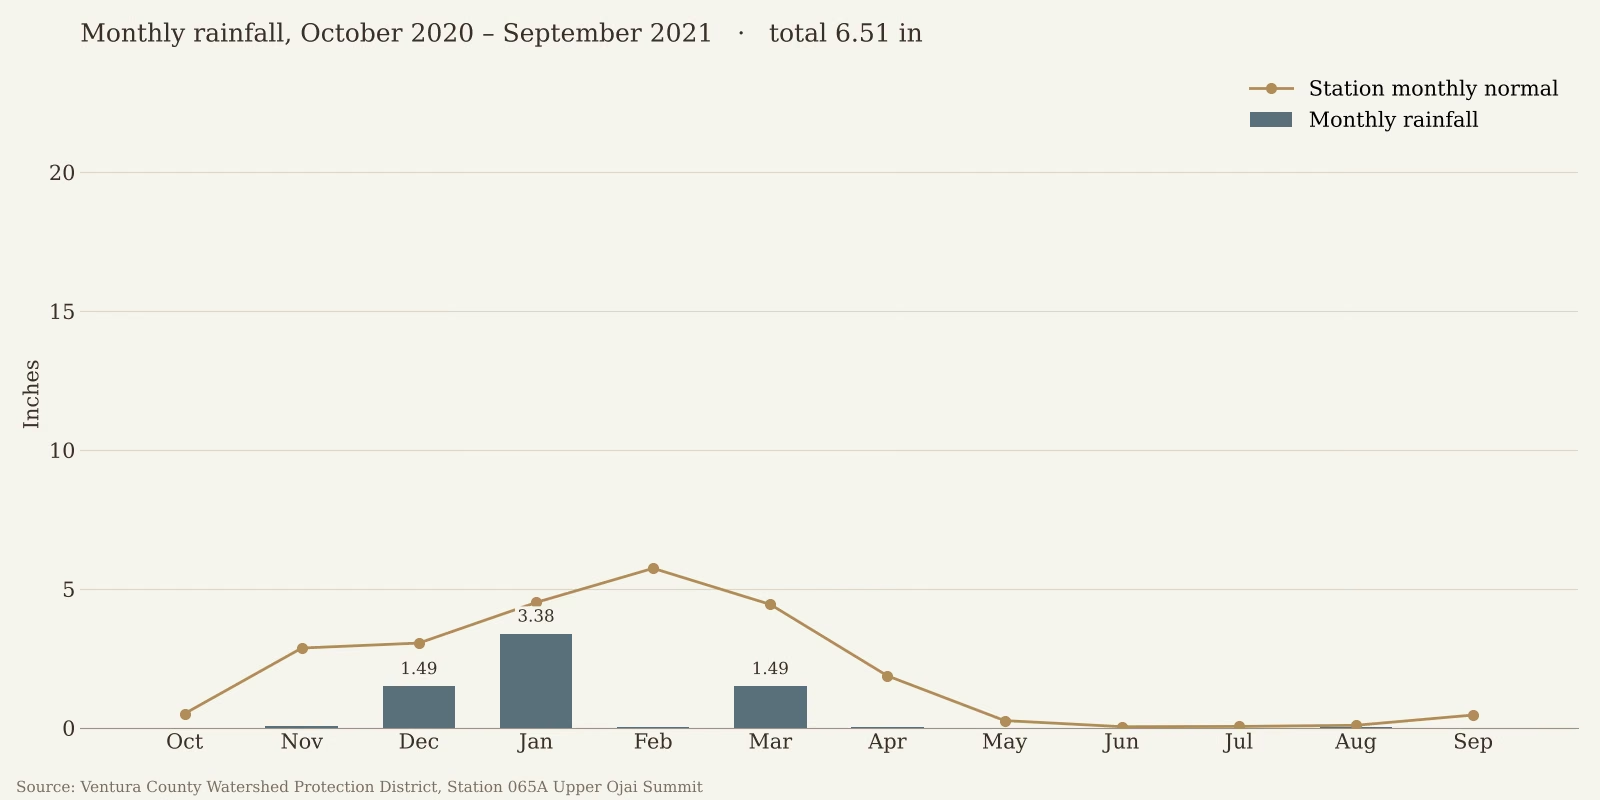
This was the driest water year in the six-season comparison. January supplied 3.38 inches, roughly half the annual total, while the rest of the season offered little sustained rainfall.
The vines were still young. A winter this lean makes water availability an important farming consideration, but it does not tell us the precise stress experienced by each vine. Root development, stored moisture and supplemental irrigation all affect that picture. Our 2021 harvest notes explore the vintage in more detail.
2021–2022: a wet December, then a long pause
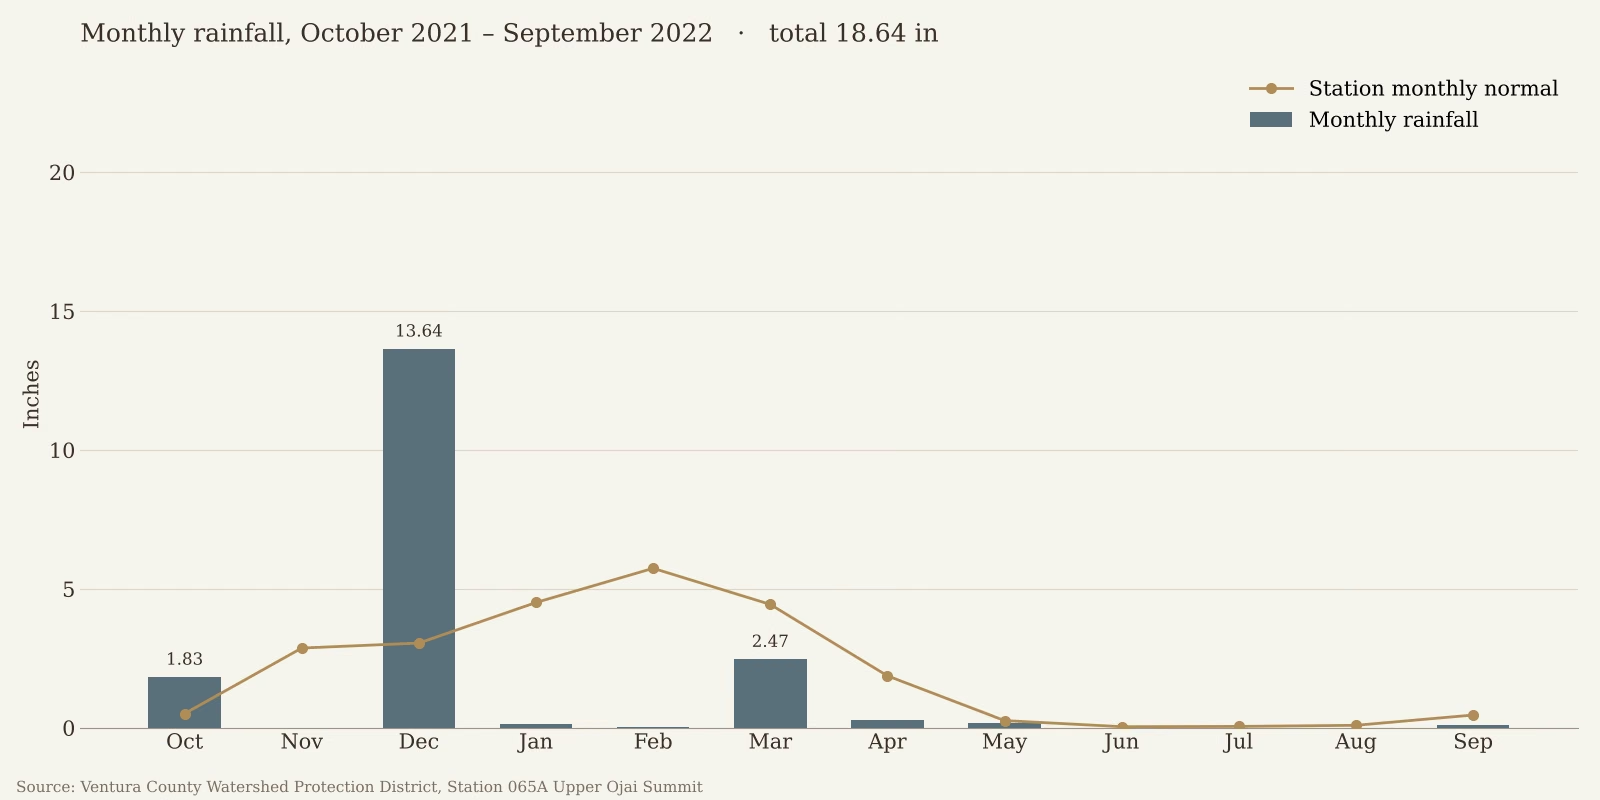
December delivered
Nearly three-quarters of the season's rain fell in one month. That makes this a clear example of a front-loaded winter: a substantial early input followed by very little rain through the next two months.
The rainfall total remained below the annual benchmark despite that wet December. It is a useful reminder that one dramatic month does not necessarily make a wet year—and that a wet start does not remove the need to monitor water later. Read the 2022 harvest notes for the next part of that season's story.
2022–2023: more than twice the annual benchmark
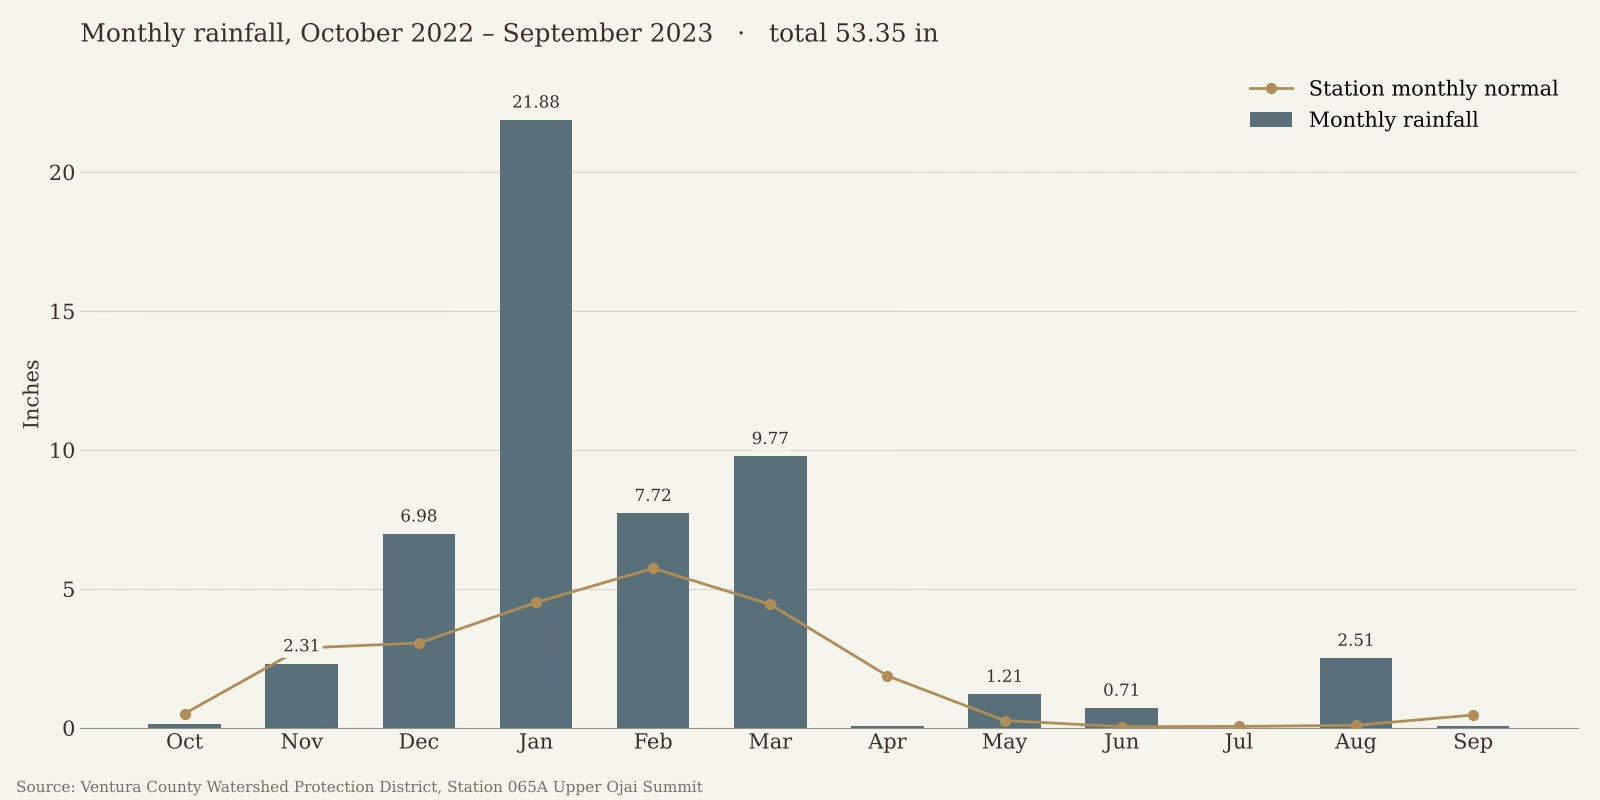
January recorded 21.88 inches, February 7.72 and March 9.77. Rain also reached well beyond winter, including 2.51 inches in August.
This was the wettest of the six completed seasons presented here. Its scale and duration set it apart from a year dominated by a single December storm.
Wet conditions can shift attention toward drainage, ground access, canopy growth and disease monitoring. Whether those risks become actual problems depends on their timing and what happens in the vineyard. The rainfall record identifies the conditions to investigate, not the outcome to assume. For the vineyard observations behind this vintage, see our 2023 harvest notes.
2023–2024: February carries much of the year
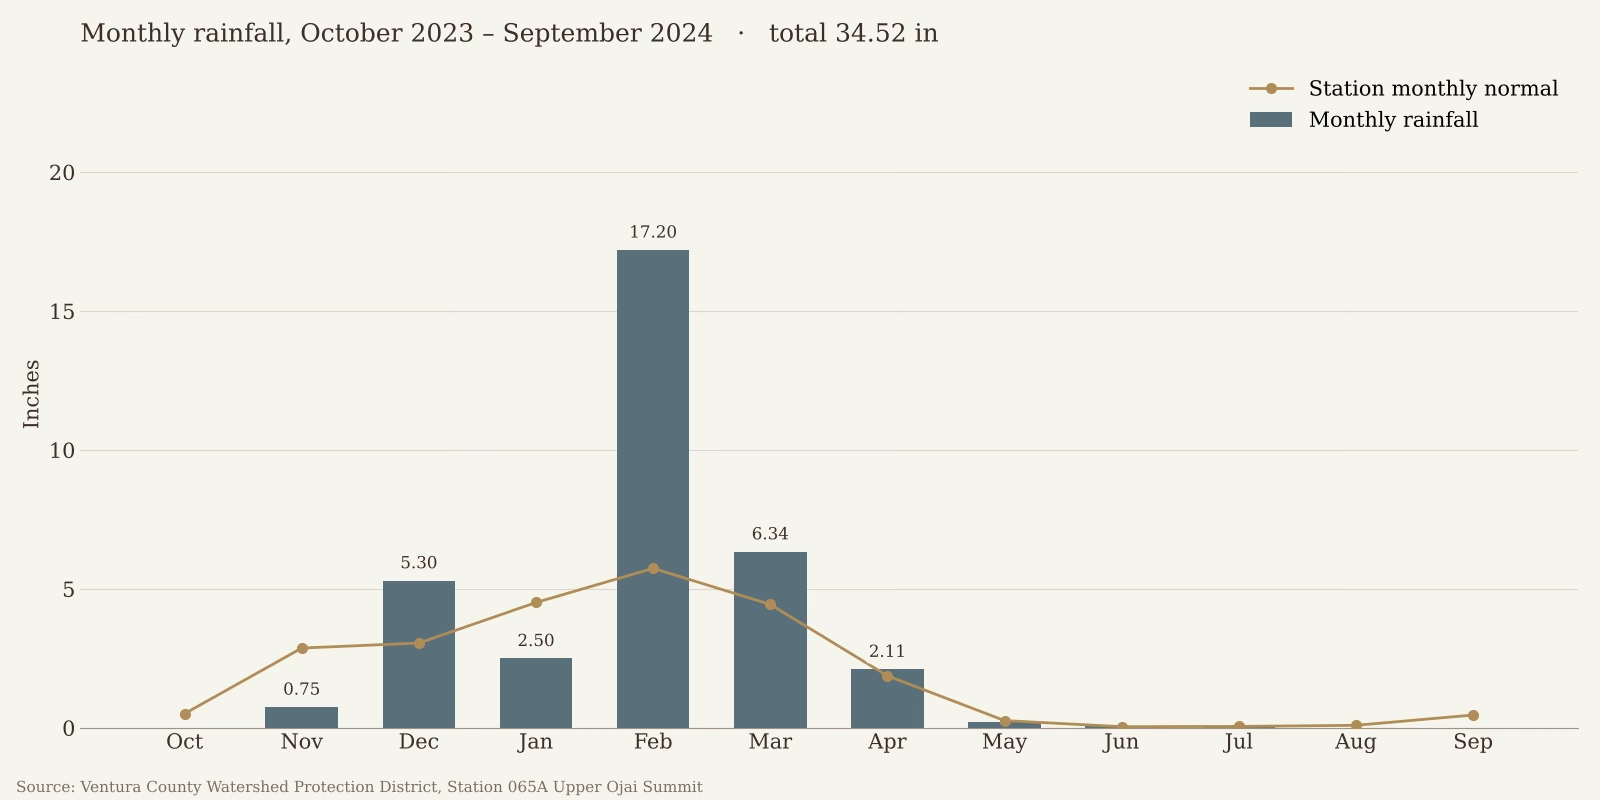
February alone brought
This was another above-benchmark year, but it was not a repeat of the previous season. Less rain fell overall, and a larger share was concentrated in February.
Two wet winters can create different sequences of work. Knowing the total is useful; knowing when the ground was wet is more useful still. The 2024 harvest notes continue the story through the growing season and picking decisions.
2024–2025: a dry opening, with most rain arriving later
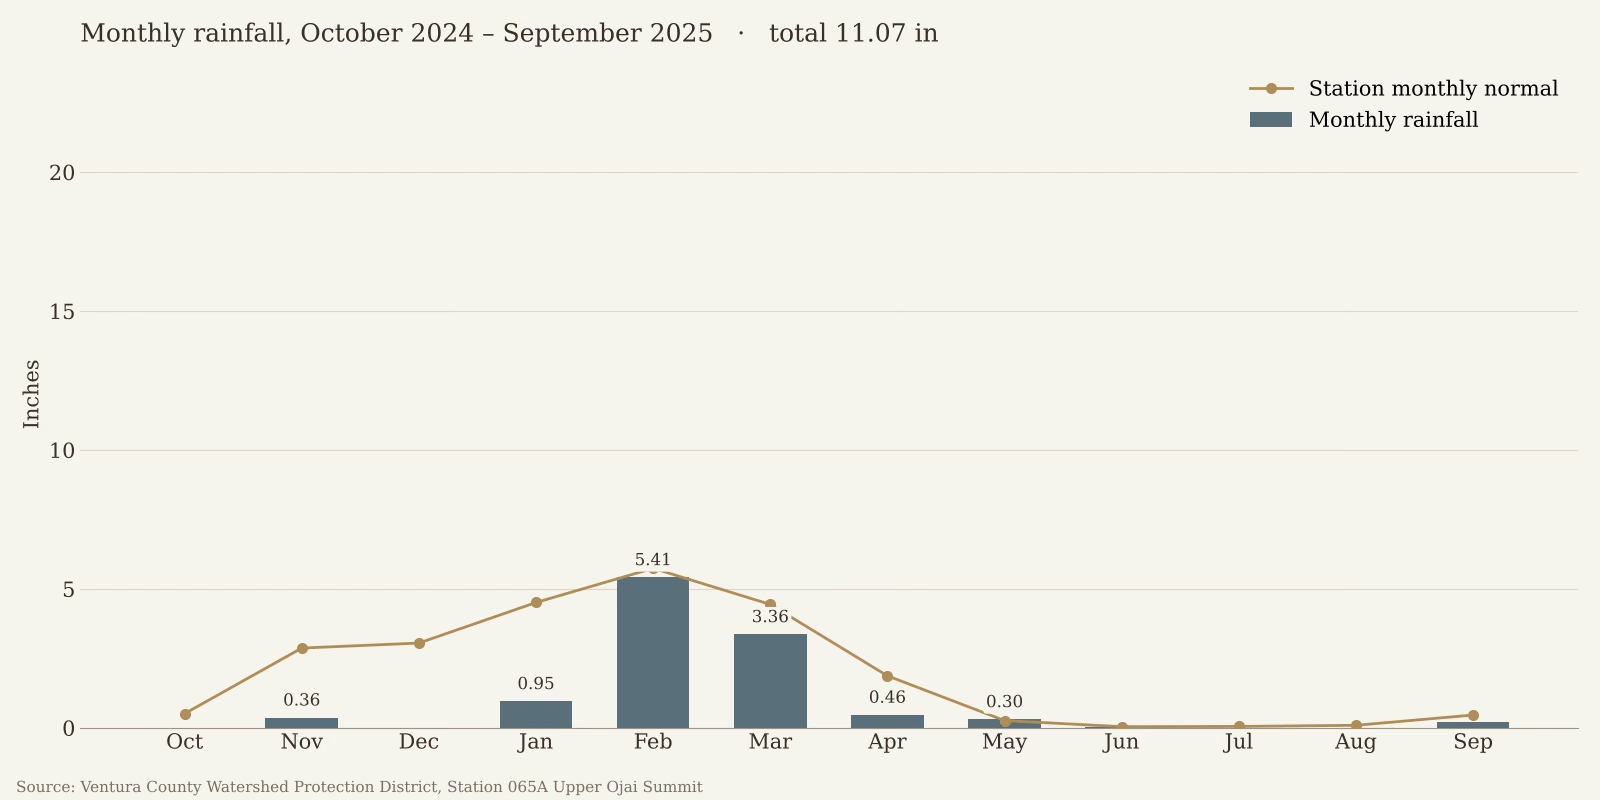
December recorded no measurable rainfall, and January supplied 0.95 inches. February and March then brought 5.41 and 3.36 inches—together, roughly four-fifths of the full year's total.
The season finished at less than half the annual benchmark. Its late-winter rain mattered, but did not erase the early shortfall in the gauge record.
That does not mean every block began spring with the same deficit. Conditions carried over from previous years, soil properties and irrigation all complicate the relationship between rainfall and available water. Read our 2025 harvest notes for the wider vintage context.
What the record changes—and what it cannot tell us
Across six completed water years, the rainfall totals varied widely. The patterns within those years varied too. That is the strongest conclusion these figures support.
They do not establish that organic or regenerative farming caused resilience, that a wet winter produced a particular flavor, or that a short run of years proves a new climate trend.
Our farming response is to pay attention rather than work from a fixed formula. Cover crops, soil care, canopy management and strategic supplemental irrigation belong to that ongoing work. The rainfall record helps frame the decisions; observations in the vineyard guide them.
A wine's vintage is a useful starting point. Reading the season behind it makes the story more specific: not simply “wet” or “dry,” but when the rain arrived, what followed, and how the team responded.
Explore the mountain behind the wines
Read about our viticulture, explore current estate wines, or plan a vineyard visit.
Frequently Asked Questions
The Station 065A report used here gives an annual benchmark of 23.89 inches. Actual totals vary widely. The benchmark describes this station's reference record, not a guaranteed amount for every location in Ojai.
A water year runs from October 1 through September 30. It groups the winter rainy season with the spring and summer that follow. The 2020–2021 water year provides context for the 2021 harvest.
Water arriving during winter dormancy presents different conditions from rain around flowering or harvest. Timing influences what growers monitor, while soil, drainage, temperature and vine development determine the actual effects.
It was the wettest of the six completed water years compared in this article, at 53.35 inches. That is not a claim that it was the wettest year in the station's entire history.
No. We use strategic supplemental irrigation when needed. Organic and regenerative farming describe how we care for the vineyard, not a requirement to avoid irrigation.
Not on its own. Rainfall is one part of the growing season. Temperature, harvest timing, vine development, blending and cellar decisions also shape the finished wine. Our article on how diurnal shift shapes wine explores the role of warm days and cool nights.
Share this post
Recent Posts
View All Posts
Lesia Artymovych • 3 Nov 2026
Five Vintages, One Mountain: The Estate White Vertical
Five Ojai Mountain Estate White vintages—2020, 2021, 2022, 2024 and 2025—show how one vineyard can express itself differently from year to year. Chang...
Lesia Artymovych • 20 Sept 2026
The Scent of the Mountain: Chaparral, Syrah, and Ojai Terroir
Ojai Mountain’s wines can carry aromas that recall the chaparral surrounding the vineyard: sage, dried herbs, pepper, and wildflowers. Science does no...
Lesia Artymovych • 16 Sept 2026
The Ojai Pink Moment: Why the Topa Topa Mountains Glow
Ojai’s Pink Moment is the brief coral, rose, and violet glow that appears on the Topa Topa Mountains around sunset. Warm, low-angle light creates the ...